WALKME · REPORT · THE STATE OF DIGITAL ADOPTION 2026
COMPANY
WalkMe
YEAR
2026
ROLE
Creative lead
TIMEFRAME
2 months
THE CONTEXT
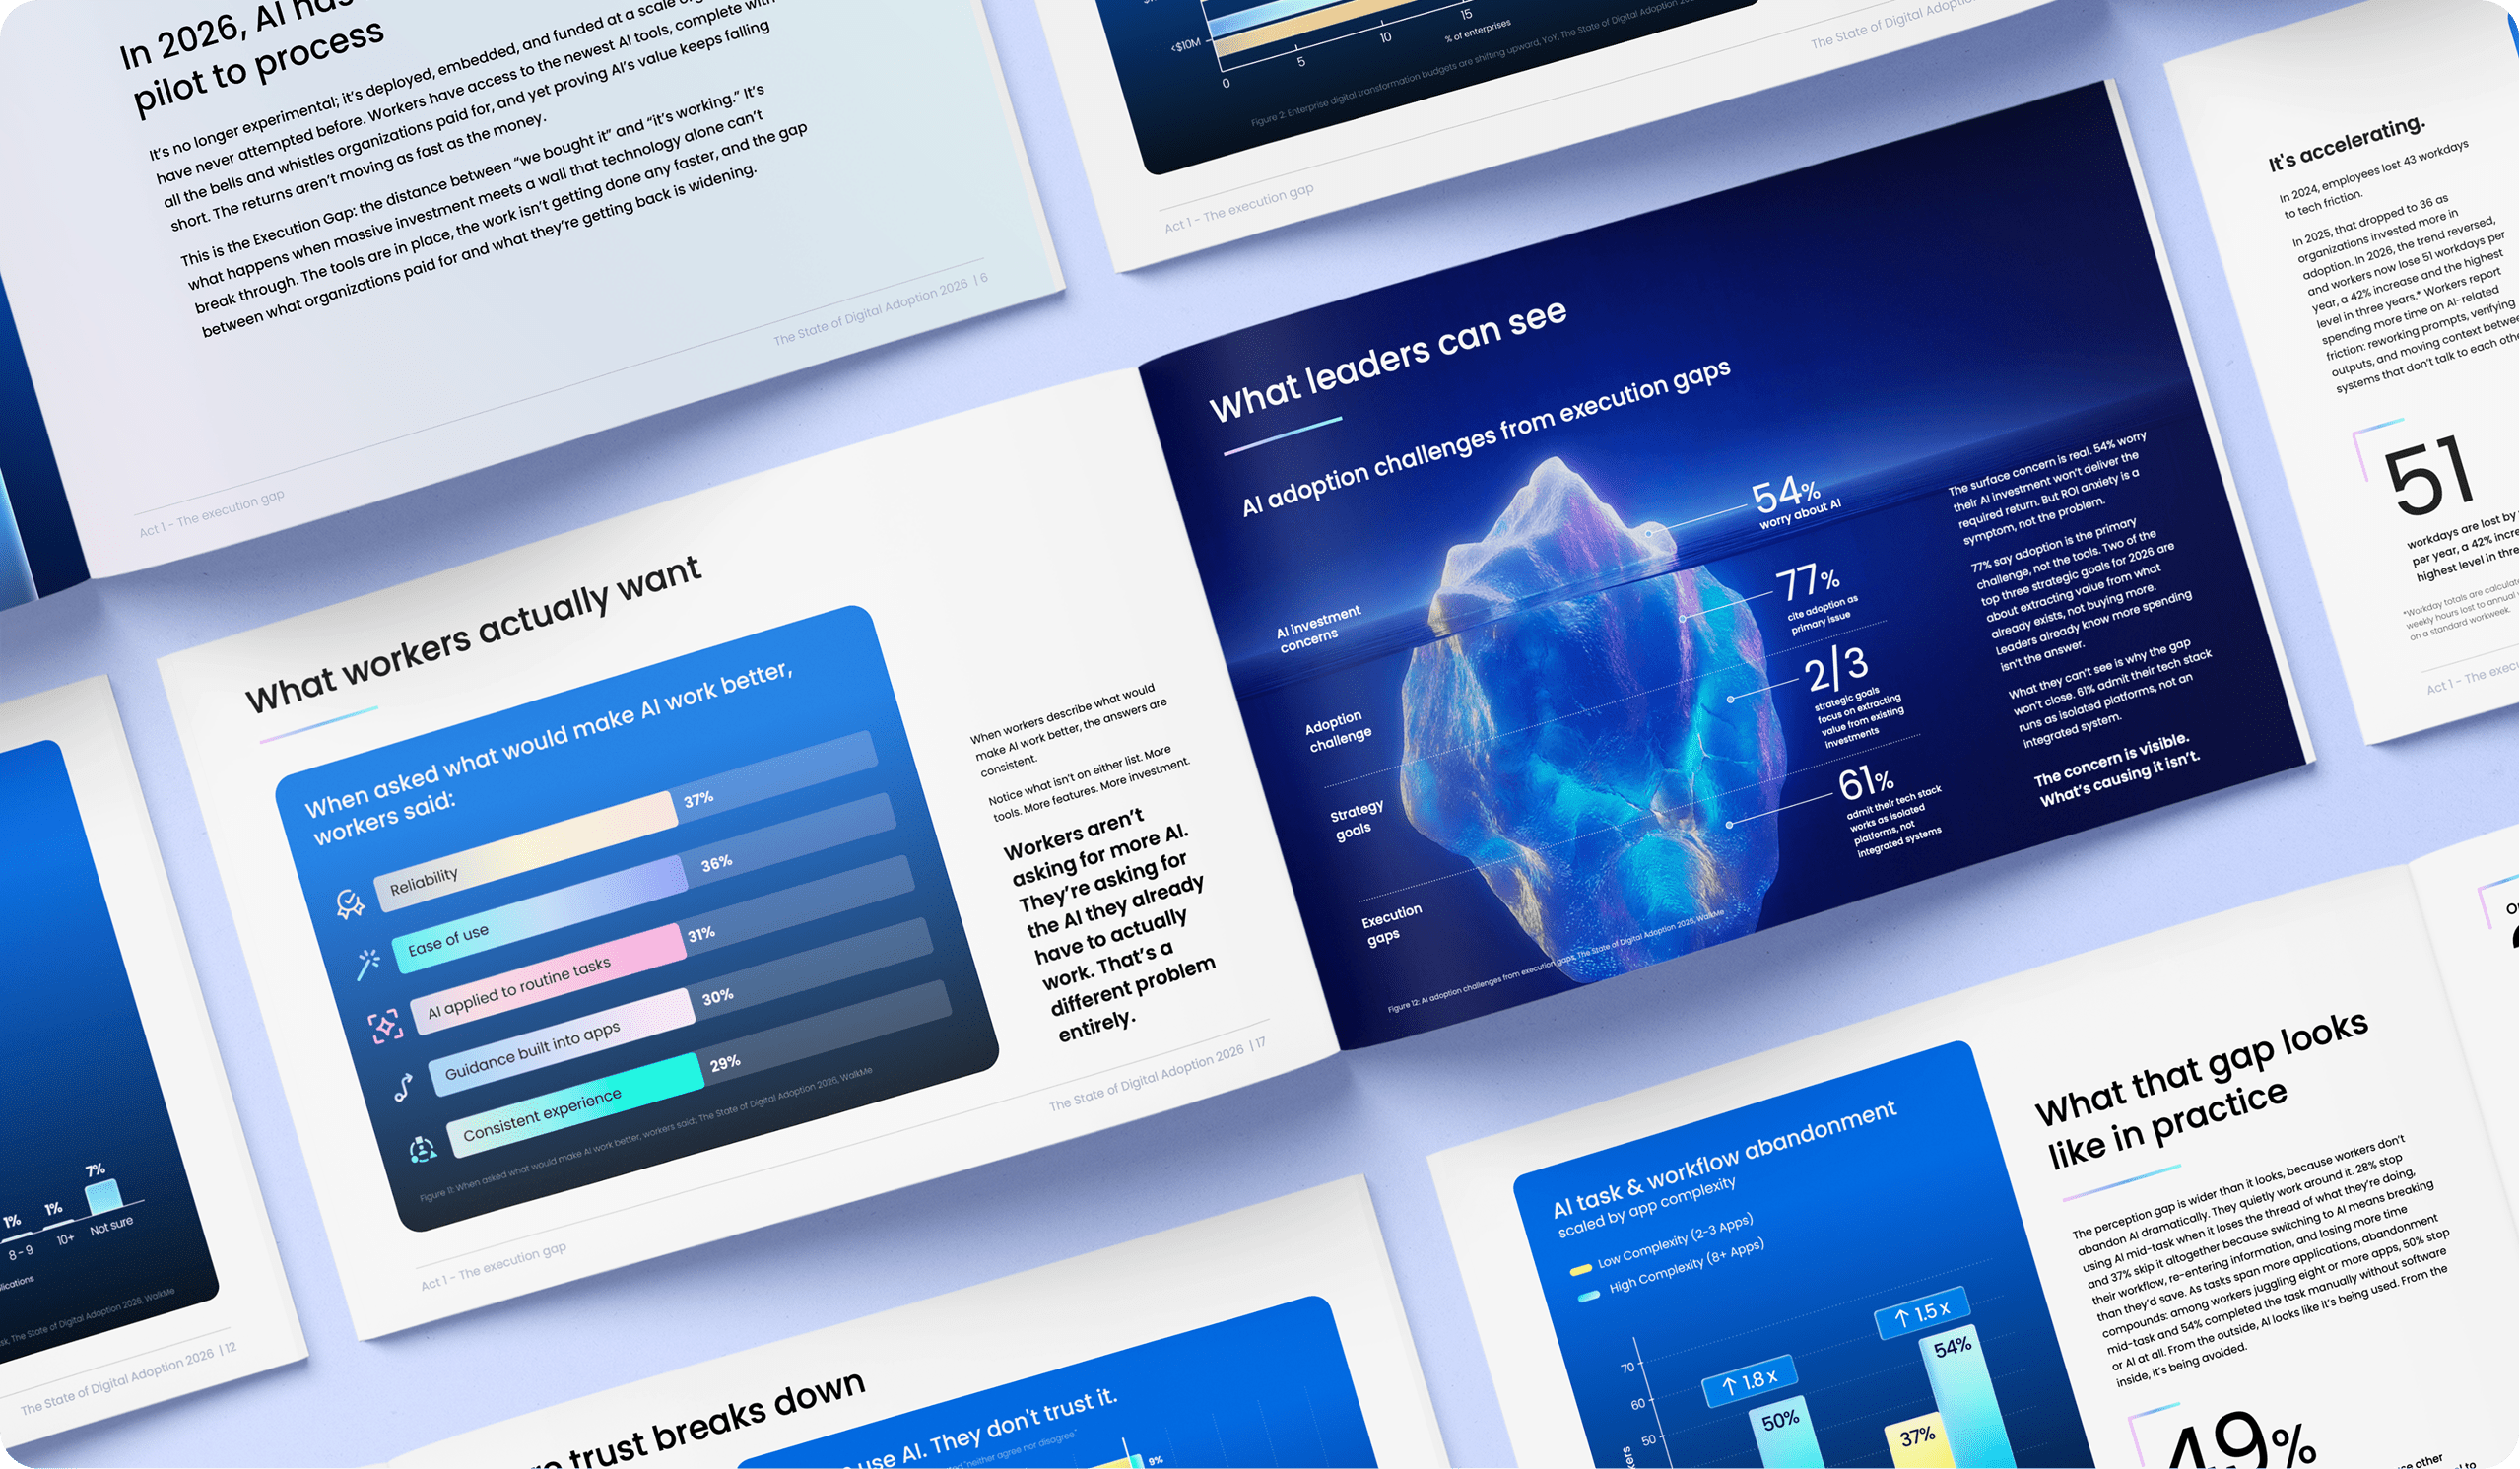
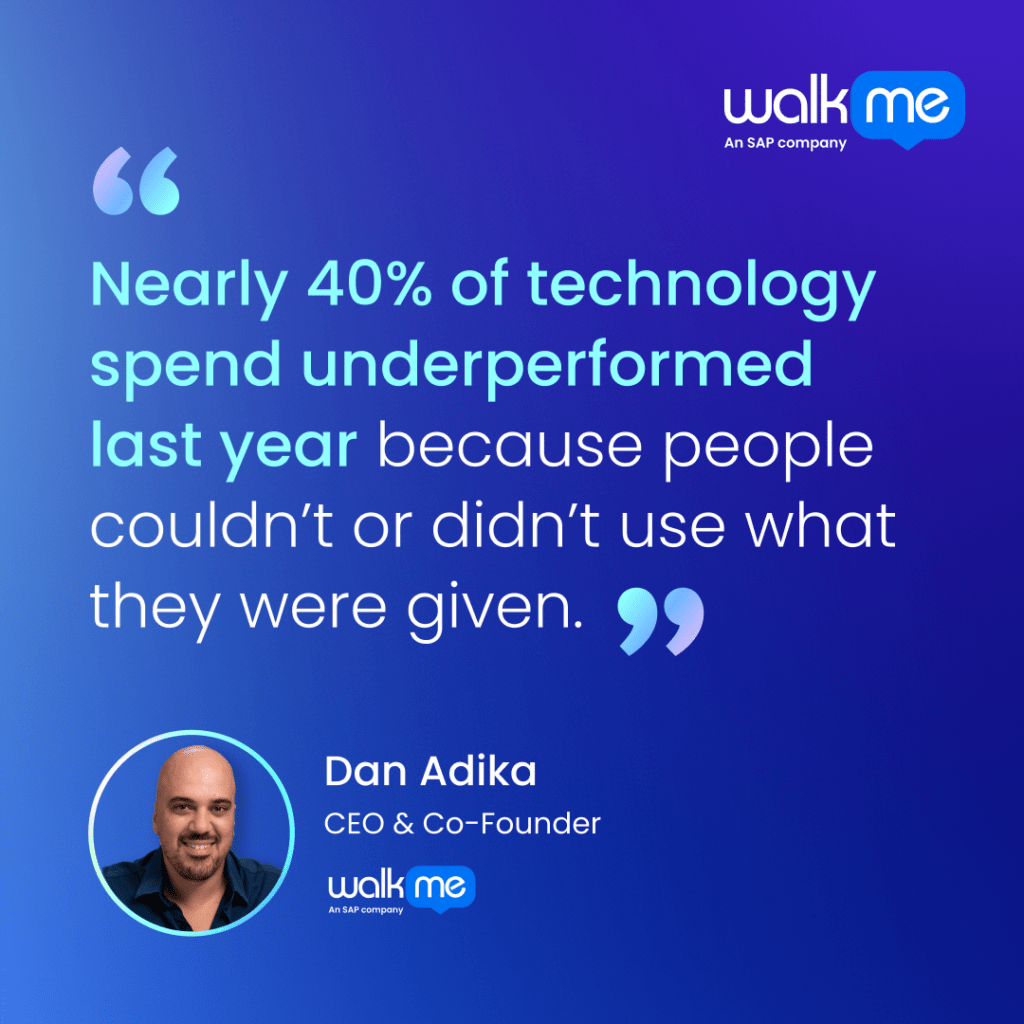
WalkMe’s 2026 State of Digital Adoption exposed a critical enterprise failure: companies are heavily investing in AI, yet employees lose 51 days a year to tech friction caused by fragmented workflows and massive context loss.
THE BRIEF
The data told a clear story. The design had to tell it just as clearly. The visual language covered the full report, then carried through every promotional asset, the campaign, and the webinar. The hard part was making the “AI Trust Gap” feel urgent without sounding alarmist, and making WalkMe’s role in solving it feel obvious.
3,750
global respondents
8
regions surveyed
51
days a year lost to tech friction
THE REPORT
A design built to scale.
Led both the visual identity and the data visualization while creating a scalable system so external agencies could localize it across languages and markets easily.


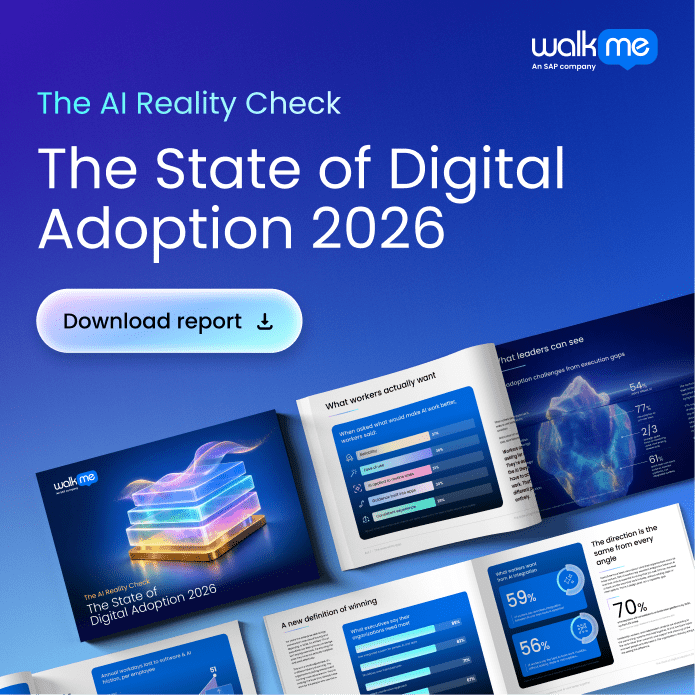
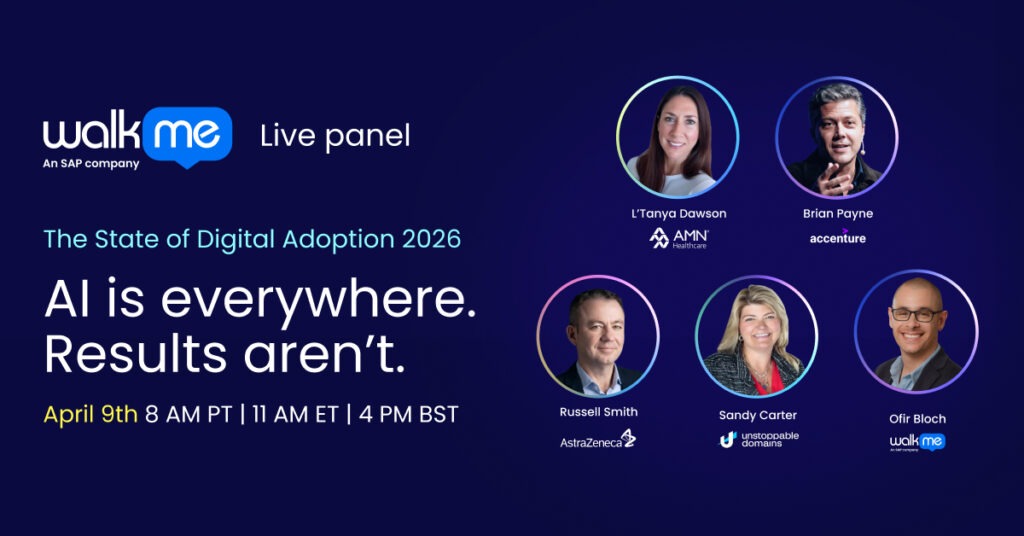
PROMOTIONAL KIT OVERVIEW
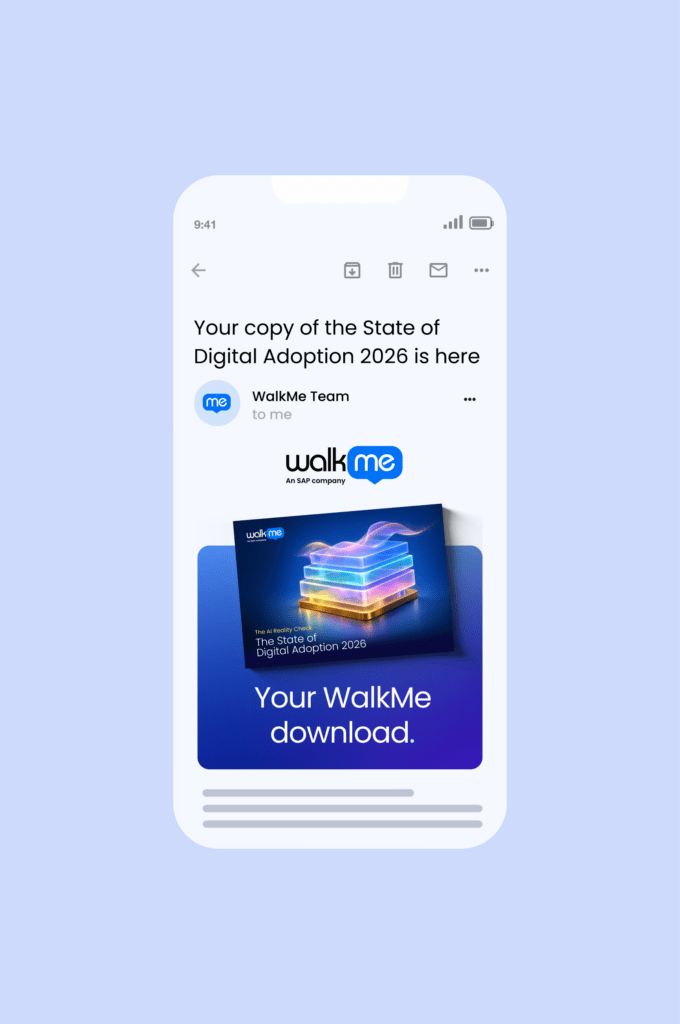
A report is only as strong as its reach
DESIGN PROCESS & APPROACH
How it came together.
THE CHALLENGE & CONSTRAINTS
Many stakeholders were involved, which meant many opinions. Context kept changing, approvals were slow and the deadline did not move with it.
THE DECISION
Give everyone something concrete to react to early, before the final content was approved. Not the ideal order, but the honest fix for a real constraint. That way the visual direction could be agreed on the report’s core idea.
So two work tracks could start.
01
Setting the art direction and the look and feel
of the campaign, starting with the cover.
02
Start the components and data system,
ready to fill in as soon as the final copy arrives.
01 Defining the Visual Identity
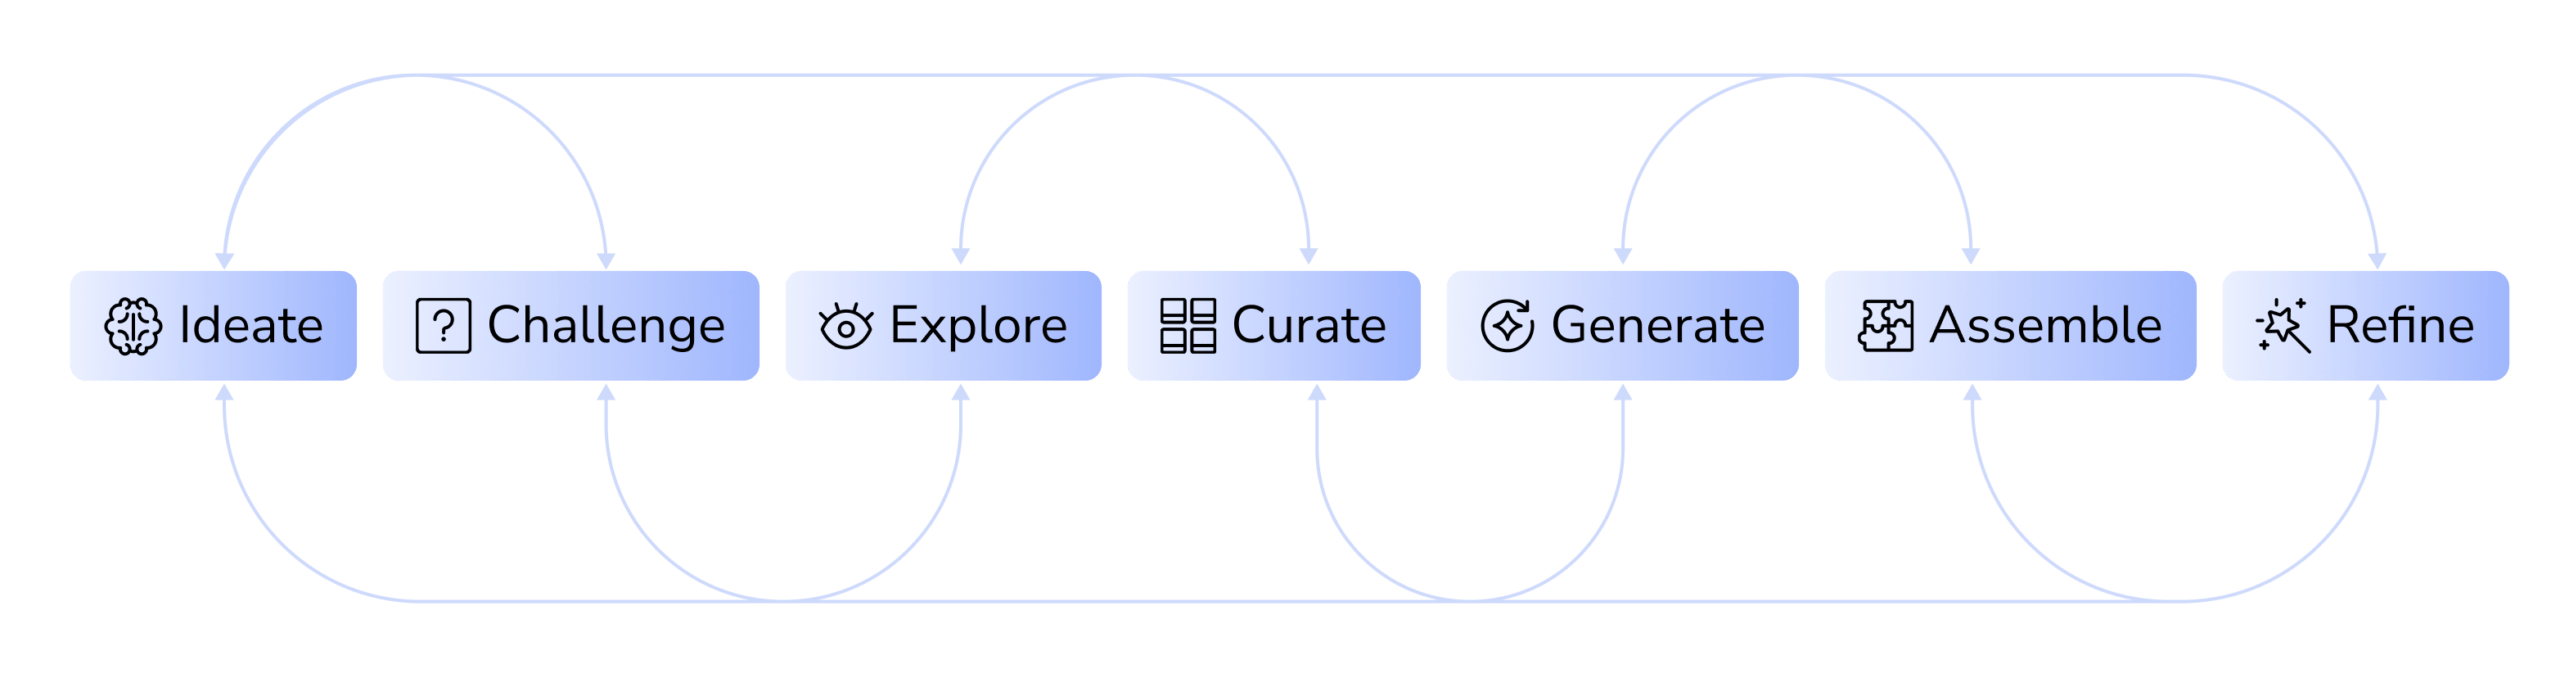
The first move was to think, not to open a tool. AI is fast and genuinely useful, but speed isn’t the starting point. The creative strategy took shape through keywords, mind maps, and analogies, then early ideas were pressure-tested with AI and the team, and anything that didn’t hold was cut. Moodboards defined the visual language, then concepts were tested fast across compositions using Higgsfield and Midjourney. The strongest directions moved into Figma for assembly and refinement.
Concept and Art Direction
The State of Digital Adoption is WalkMe’s flagship annual research report. The cover had one job: take an abstract idea and make it visual, while moving the report’s design language forward from previous years.
The insight
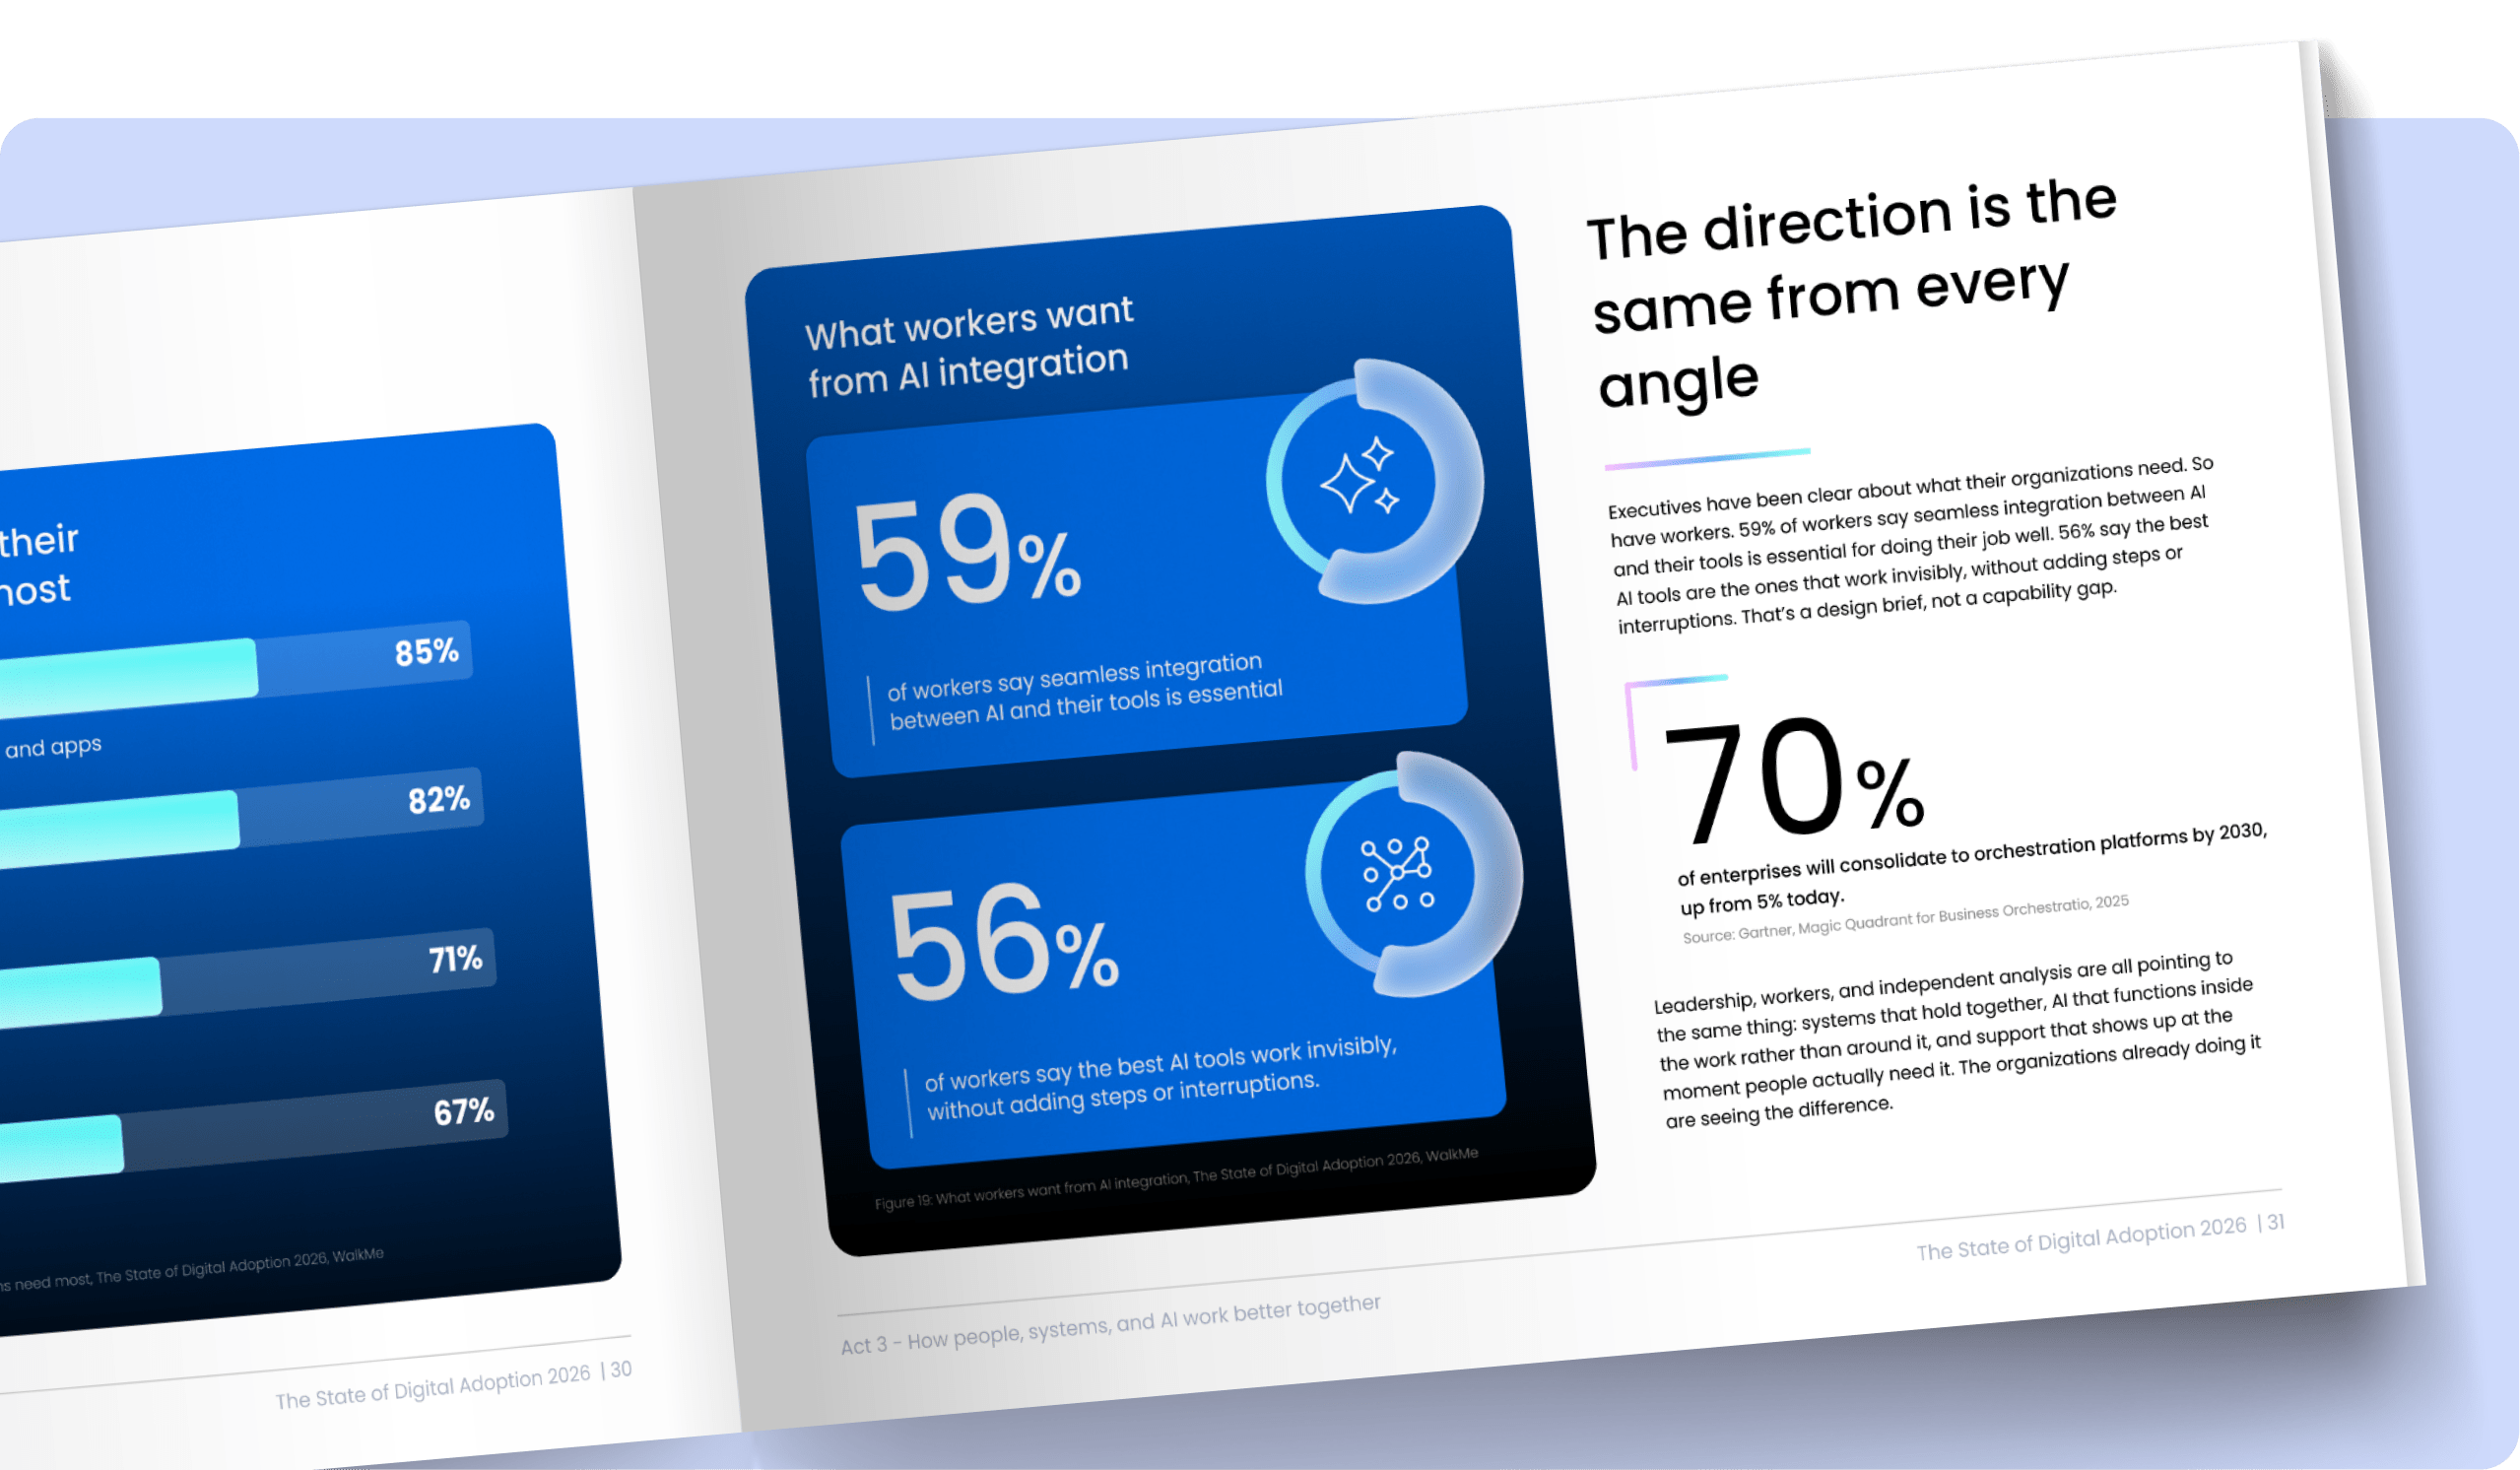
The real barrier to AI value isn’t the technology. It’s the missing orchestration layer, the thing that connects fragmented tools and turns scattered adoption into real outcomes. That idea set the visual language: connection, layering, structure.
Directions explored
Several directions translated that insight from different angles. Each was tested against one question: Does it translate the message clearly?
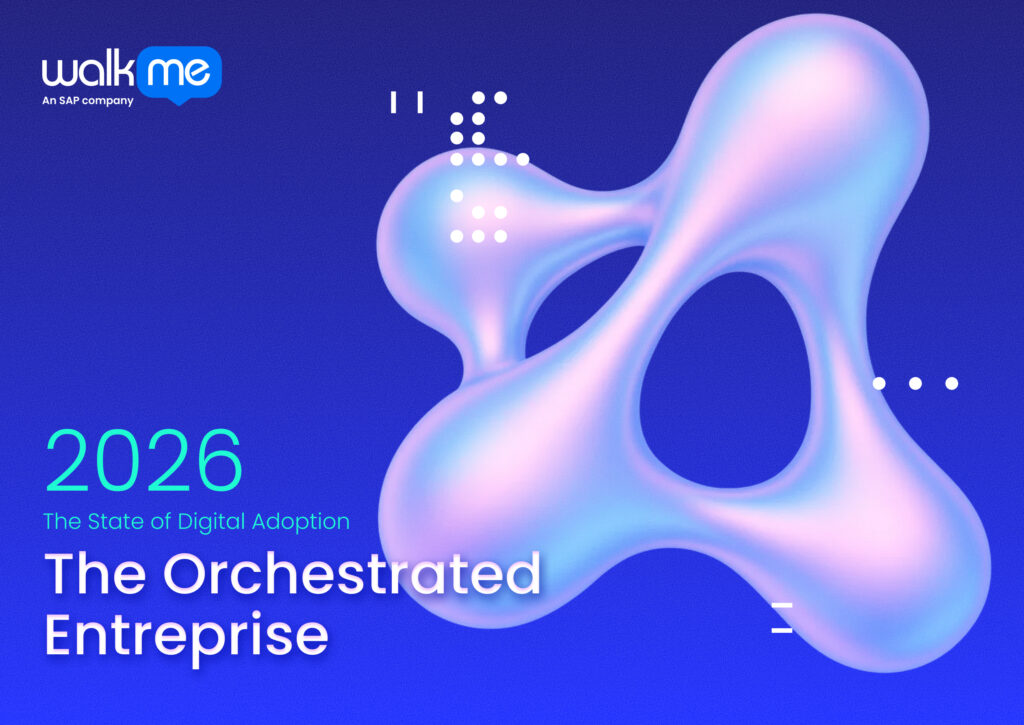
OPTION 1
Connection Synergy
Scattered tools, teams, and data points behaving as one connected system.
→ Too familiar, not eye-catching enough.
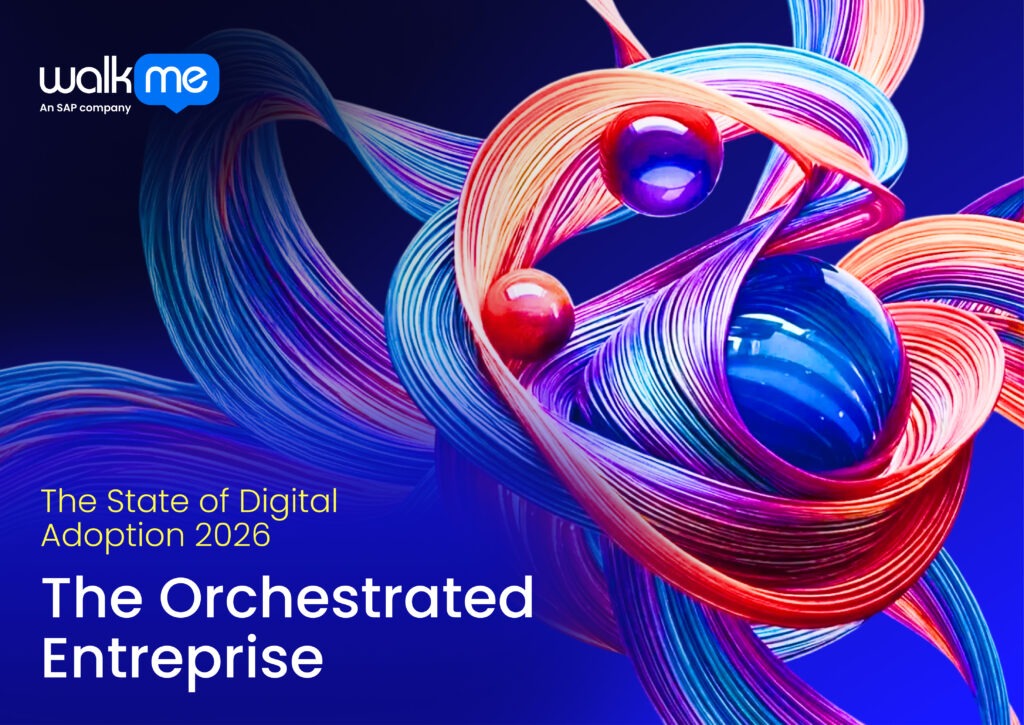
OPTION 2
Organized Chaos
Owns the messy reality most companies live in: orchestration brings order rather than erasing the chaos.
→ The narrative couldn’t yet prove the chaos was under control, so the cover promised more than the pages.
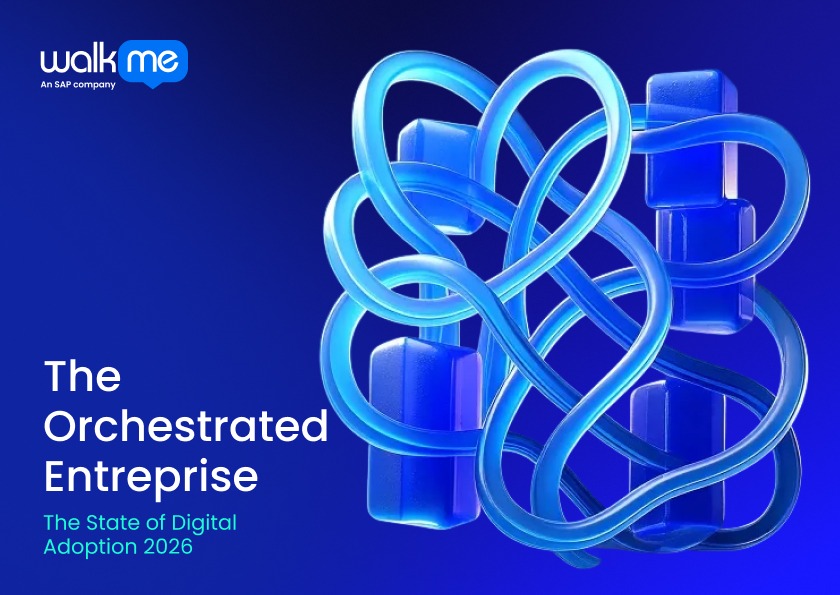
OPTION 3
Encompass
Orchestration as the layer that wraps the stack and holds it together, positioning WalkMe as the connective tissue of the enterprise.
→ Strong, but echoed last year’s circular cover. The idea earned a place, the execution had to move on.
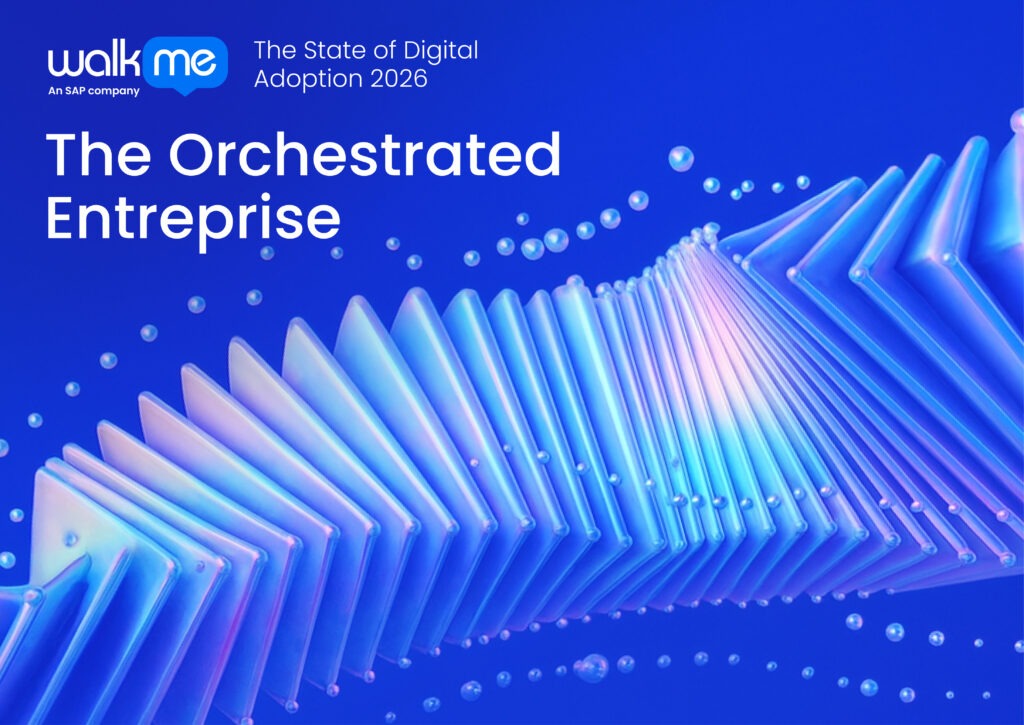
OPTION 4
Layers Movement
Orchestration as architecture, built in deliberate layers.
→ A similar layered language was already circulating in the category, so it needed its own signature.
The Pivot
The report led with orchestration. But the product was not ready to orchestrate every layer yet, so the team restructured the story. It was renamed “The AI Reality Check,” opening with the hard truth about AI and building toward orchestration as the destination, not the opening claim.
Refining the Art Direction of the layers
The AI Reality Check: the report is here to show clarity on what’s happening in enterprises with AI and ‘The AI Trust Gap’.
Glass here was used not only as a trendy tech look but to carry the meaning: transparency, bringing hidden AI frustration into view. The visual helped the audience to get the message faster.
The final cover is made of frosted glass, translucent layers stacked over a reflective surface, with blue and pink light moving through them. The material says it all. Many layers reading as one calm surface, which is orchestration in one image. And the transparency carries the honesty of “The AI Reality Check”: you see straight through to the gaps every employee hits with AI, the steps that don’t connect, with orchestration as the thing that closes them.
02 Defining Components Style
Stats Style
To go with the same vibe of glass-like stats: Two variations were proposed.
One lighter fresh theme and a more contrasted one.
The more contrasted one was chosen as it scales more easily for print and web.
With the look and feel locked and approved, one job was left: the data visualization, shaped to each piece of content. The style layer was already settled, so every asset shipped without rebuilding it. The work moved much faster.
OUTCOME
Project Success
Organic Gartner citation
Gartner referenced the WalkMe State of Digital Adoption 2026 report in a research note, citing the stat “80% of workers currently avoid or reject enterprise AI.” An unpaid, unsolicited editorial citation. The design and content earned credibility.
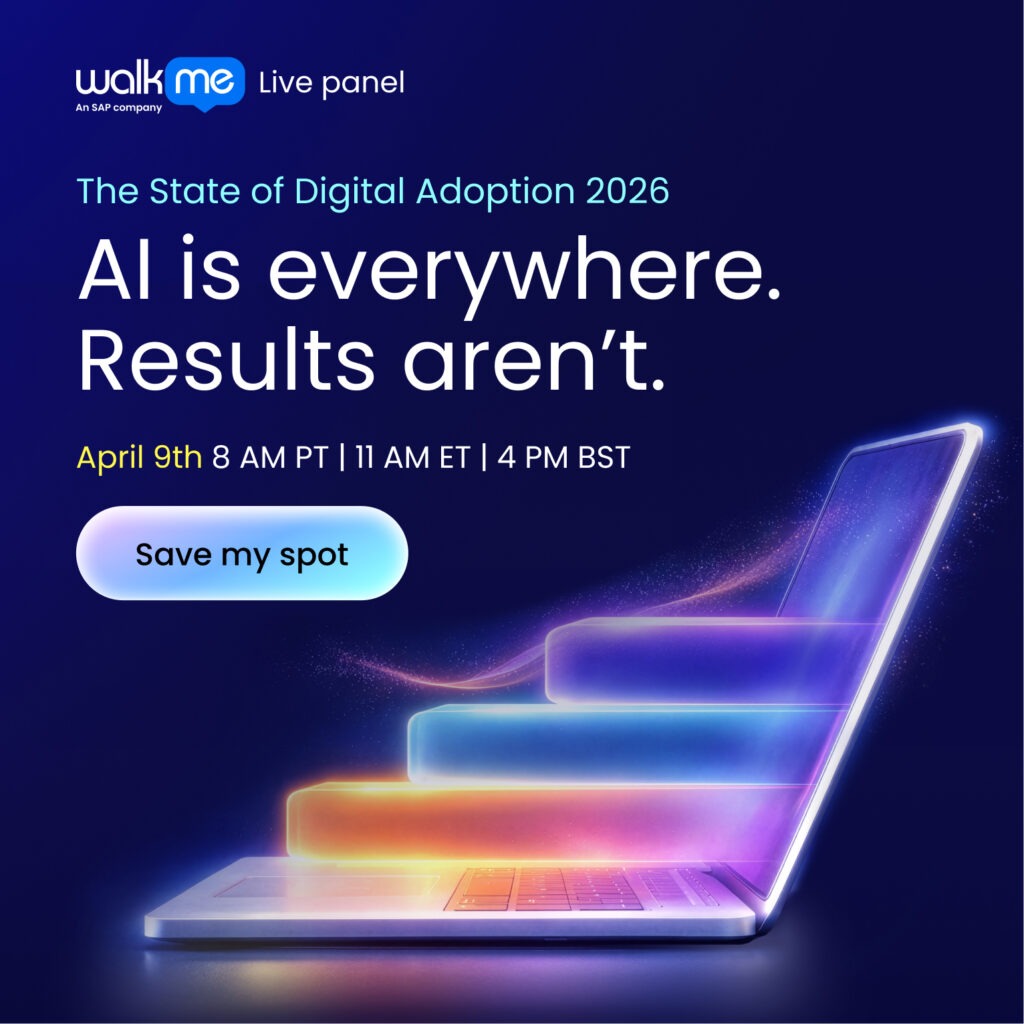
Beat the registration target
Registrations of the webinar reached 943 against a goal of 650, a 45% beat, with a 34% live attendance rate. Strong design turned interest into action.
A design built to scale
Designed as a master creative file, then handed to external agencies that localized and deployed it in French, German, and Japanese.